Goals and Assists : Spain at the 2026 FIFA World Cup
DATAVIZ BY: EDWIN MENDIVIL BARCELÓ | @VIZUALDATOS
Explore how Spain's assists were distributed across the team.
How many goals were unassisted?
Which players were both Assist Providers and Goal Scorers?
Start to scroll and see who passed to whom on this 3D Chord Diagram Ball!.
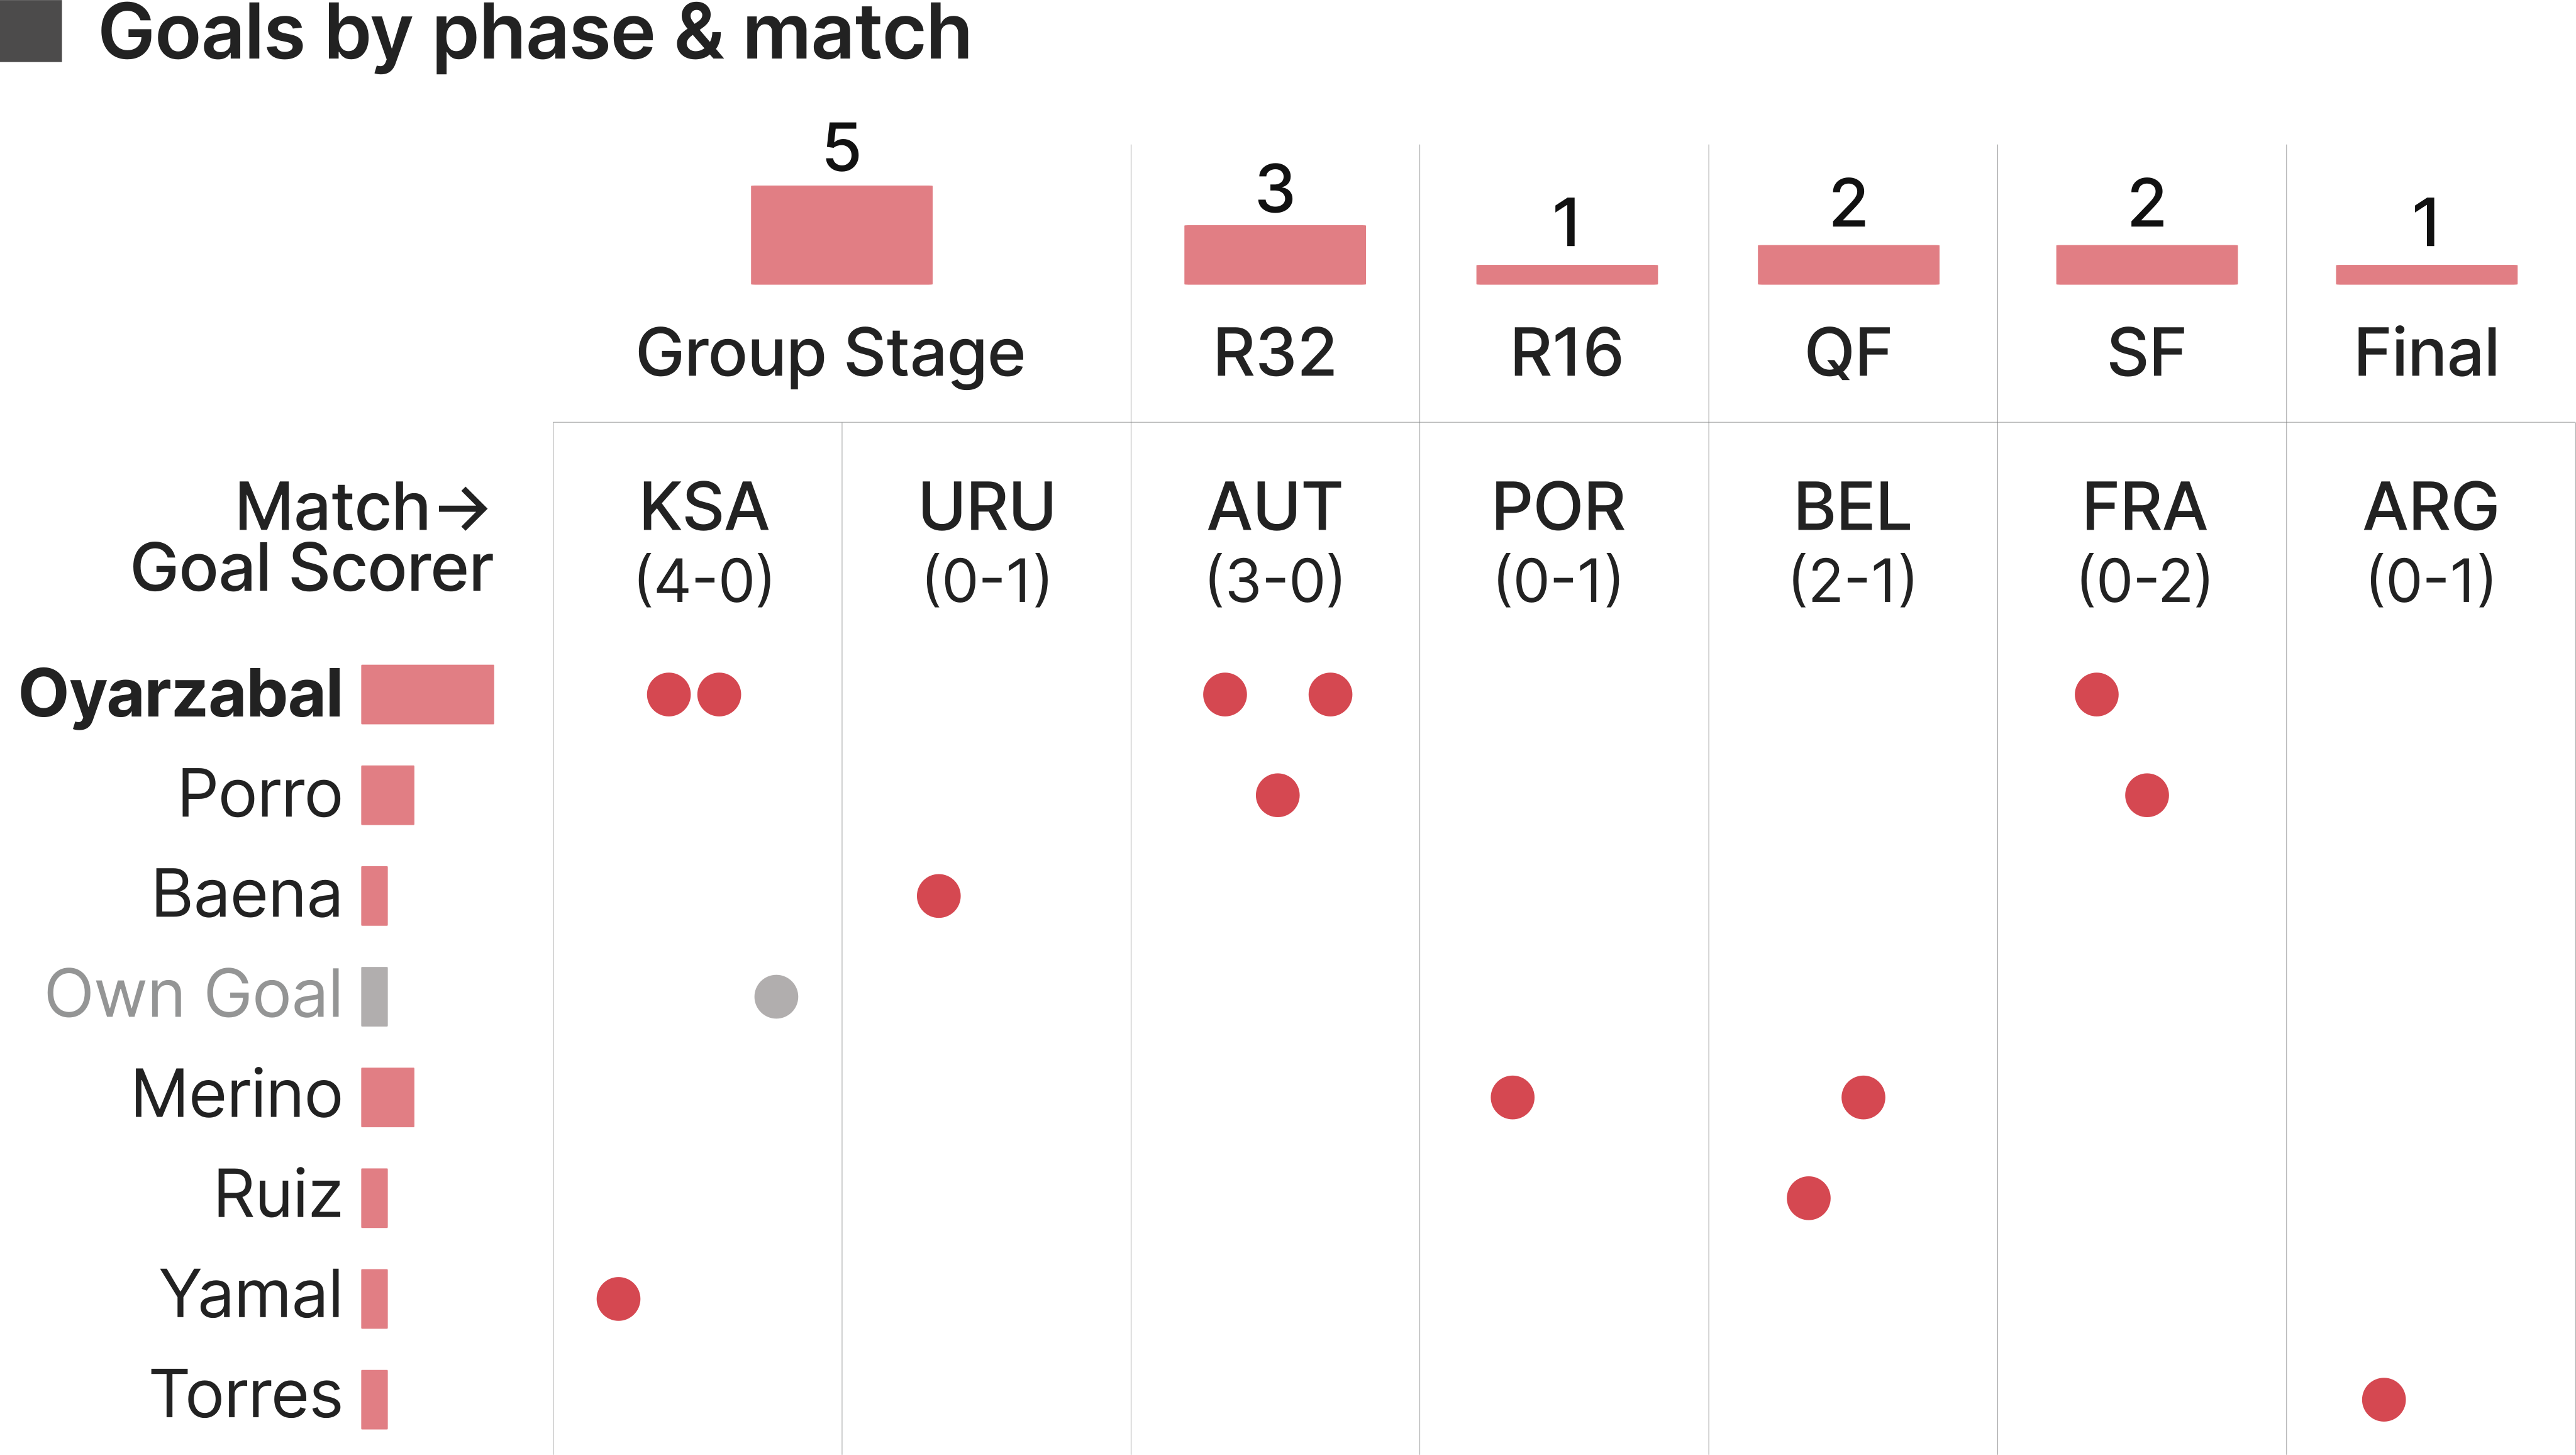
Who scored Spain's 14 goals?
○ Spain was the fourth-highest-scoring team, with 14 goals.
○ Seven players scored.
○ One was an opponent's own goal.
○ Oyarzabal was Spain's top Goal Scorer, with five goals.

Who were the Assist Providers?
○ Four goals were unassisted.
○ Eight players provided assists; six had one assist each.
○ Cucurella & Olmo were the top Assist Providers, with two assists each.

Who passed to whom?
Passes to Oyarzabal
○ The Goal Scorer received assists from Cucurella (2), Olmo (1), and Laporte (1). One goal was unassisted.
Four unassisted goals
○ Oyarzabal, Merino, and Ruiz scored without an Assist Provider. The fourth was an opponent's own goal.
A Concept for a Soccer Ball Design
DATAVIZ BY: EDWIN MENDIVIL BARCELÓ | @VIZUALDATOS
This visual story is also a concept for a Soccer Ball design based on a Chord Diagram.
The circular layout of the chart and the curvature of the arcs can become an eye-catching design element.
It could be a data inspired design: where the design changes partially or completely according to the data.
Imagine France's, England's, or Argentina's version. The same chart, different colors, different balls.